

From my personal experience, one of the most important parts of building predictive models and recommender systems is to have robust and straightforward assessment and evaluation systems in place. Splitting your data into training and test sets, developing the model on the training set and eventually evaluating it on the test set is best practice. Besides this simple 2-fold cross-validation there are many other types of cross-validation, which should be applied according to the problem (and size of the available data) at hand.
No matter how complex your recsys is, whether it’s item-base or user-based, programmed in mahout, R, python or SQL, you should always be able to evaluate two completely different recommender against the same set of evaluation metrics. Only then are you able to understand differences in performance and accuracy between recommender algorithms. This is key for choosing the best algorithm for your problem.
Ultimately you want to test if your recommender positively impacts user behavior by conducting a split-test and measuring incremental changes in your KPI of choice (sales, active users, clicks). But before one can evaluate the recommender online, i.e. with real users, one should be sure to have developed the best recommender possible and assessed it’s quality offline.
In the following I will describe three popular evaluation metrics for recommender systems through examples. Those metrics take into account the order of the recommended items:
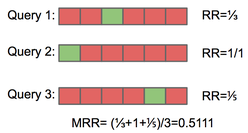
Mean Reciprocal Rank (MRR)
MRR evaluates recommender that produce a list of ranked items for queries. The reciprocal rank is the “multiplicative inverse” of the rank of the first correct item. For calculating MRR the items don’t have to be rated. MRR doesn’t apply if there are multiple correct responses (hits) in the resulting list.

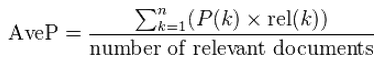
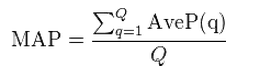
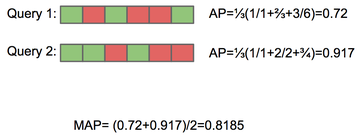
Mean Average Precision (MAP)Average precision calculates the precision at the position of every correct item in the ranked
results list of the recommender. The mean of these average precisions across all relevant queries is the mean average precision or MAP. Similar to MRR, AP and MAP don’t consider the rating of
items by the user.
Discounted Cumulative Gain (DCG)
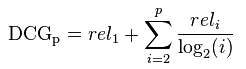
DCG uses the rating of each item (for example 5-star reviews for movies) and evaluates the “gain” of an item according to its position in the result list of a recommender. It assumes that a recommender is more efficient when higher rated items appearing early in a list before the lower rated item. For discounting according to an item’s position a logarithmic reduction factor is applied as follows:
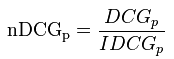
For comparing DCG’s across different queries and different lengths of resulting lists a normalized DCG (nDCG) is being calculated. All items of a result list will be sorted by relevance producing an ideal DCG (IDCG) till position p. Dividing the actual DCG by this IDCG gives the normalized DCG:
Example:
- 10 ranked documents judged on 0-3 relevance scale: 3, 2, 3, 0, 0, 1, 2, 2, 3, 0
-
discounted gain: 3, 2/1, 3/1.59, 0, 0, 1/2.59, 2/2.81,
2/3, 3/3.17, 0 = 3, 2, 1.89, 0, 0, 0.39, 0.71, 0.67, 0.95, 0
- DCG: 3, 5, 6.89, 6.89, 6.89, 7.28, 7.99, 8.66, 9.61, 9.61
There is a collection of evaluation metrics by Ben Hamner, which I can strongly recommend and which is being used in competitions on kaggle.com: https://github.com/benhamner/Metrics
In one of the next blog posts I’ll describe a really simple but easy to use recommender developed in python. You might find it strange to discuss evaluation metrics before presenting an actual recommender. But in my view the understanding of those metrics might even be more important than understanding the recommender engine itself.
Write a comment
SACHIN MANOHAR GAIKWAD (Wednesday, 14 June 2017 08:22)
Its really helpful and easy to understand. Thank you.
SACHIN MANOHAR GAIKWAD (Thursday, 22 June 2017 02:43)
Hello.
Can you just elaborate more with example how the MRR and MAP works.
for ex. user1 got recommended five products [5,8,2,3,4]
so how we are evaluate that recommendation is valid or not.
MOHAMED (Thursday, 26 July 2018 10:14)
I want to thank you for this very helpful and simple explanations.
Thank you very much !
MOHAMED (Sunday, 13 December 2020 21:18)
Its really helpful and easy to understand. Thank you.